
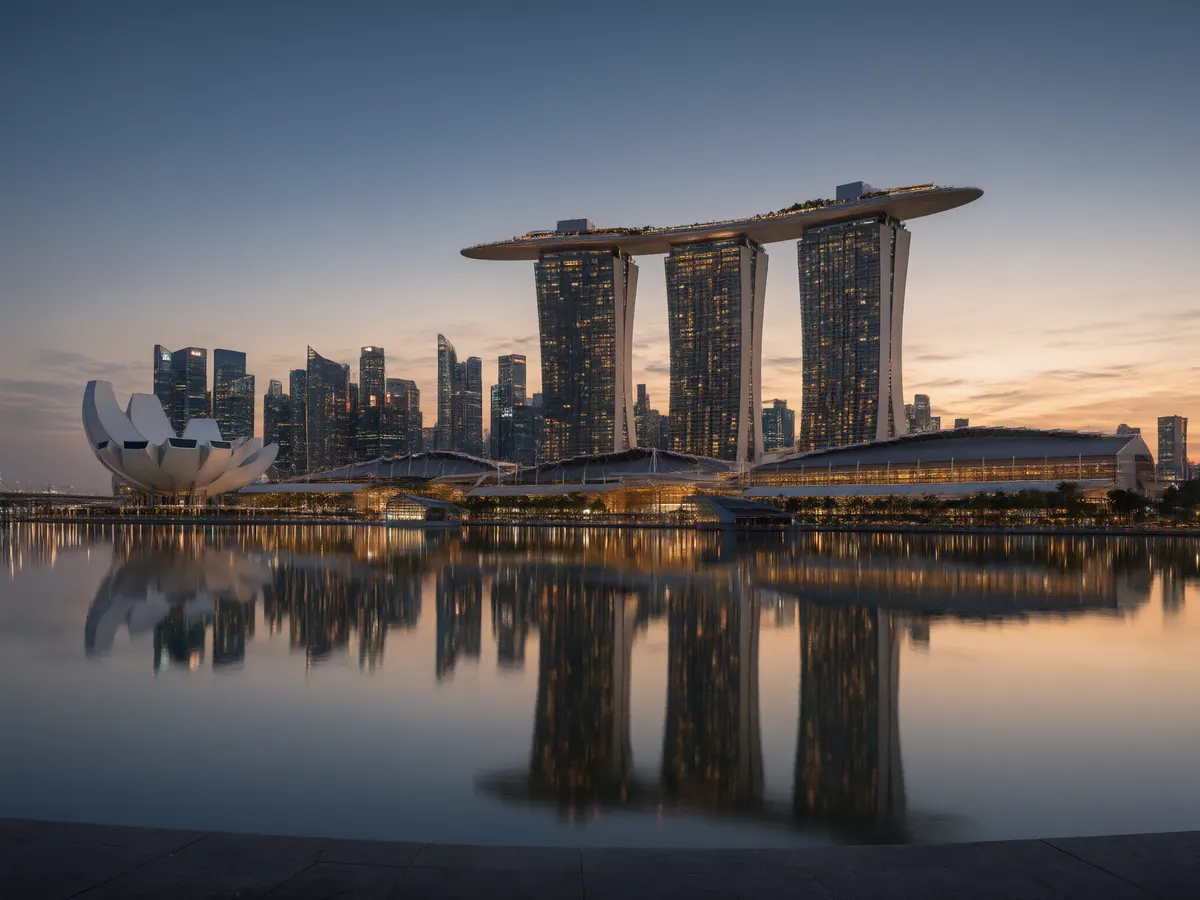
Twelve point seven million people arrived in Singapore between January and September 2026, down 1.7% year on year, according to Singapore Tourism Board figures reported by GGRAsia. For a market whose two casino resorts were built explicitly as tourism infrastructure, a shrinking headline arrivals number is the kind of data point that gets forwarded around analyst desks before anyone has checked what it actually measures.
It is worth slowing down on that last part, because the figure measures fewer things than most people assume.
What the Singapore Tourism Board figures say, and what they leave out
The reported data covers a nine-month period, January to September 2026, with a total of 12.7 million international visitor arrivals and a 1.7% decline against the same stretch of 2025. That is the whole of the verified picture as it stands in the wire report.
What the report does not provide is a breakdown by source market or by month. There is no stated split showing whether the softness came from Chinese arrivals, Indonesian arrivals, Indian arrivals or long-haul Western travellers, and no indication of whether the decline was concentrated in a particular quarter or spread evenly. Anyone circulating a confident explanation for the dip is adding something that is not in the data. Length of stay, hotel room nights and per-visitor spending are also absent, and those three variables matter more to an integrated resort’s profit and loss than the arrivals count itself.
Why footfall matters to Marina Bay Sands and Resorts World Sentosa
Singapore’s two integrated resorts, Marina Bay Sands and Resorts World Sentosa, earn money from gaming and from a stack of non-gaming businesses that are far more directly exposed to visitor volume than the casino floor is. Hotel rooms, retail leases, attractions, food and beverage, concerts and the conventions and exhibitions business all price off bodies arriving in the city. Arrivals are therefore a reasonable leading indicator for part of the revenue base, not a proxy for gross gaming revenue.
The distinction is easy to lose. Gaming revenue at the two properties depends on who visits rather than how many, on the mix between mass-market play and premium or VIP play, and on local demand, which sits outside the arrivals series entirely because Singapore citizens and permanent residents are domestic customers paying a casino entry levy, not tourists.
How IR revenue splits between gaming and non-gaming
Both operators report gaming and non-gaming segments separately, and both have committed to large expansion programmes agreed with the Singapore government that lean heavily on non-gaming capacity: more hotel inventory, more entertainment space, more MICE floor area. The strategic logic of that spending is to make the properties less dependent on any single demand stream. The practical consequence is that a broad tourism wobble touches more of the business than it would have fifteen years ago, but touches the highest-margin parts of it less directly.
Rough guide to where arrivals data bites, based on how these revenue streams work rather than on any published figure:
| Revenue stream | Sensitivity to inbound arrivals | Why |
|---|---|---|
| Hotel rooms | High | Occupancy and room rates track visitor volume almost directly |
| Retail and attractions | High | Footfall-driven, with limited local substitution |
| MICE and conventions | Medium | Booked months or years ahead; lags broader travel cycles |
| Mass-market gaming | Medium | Depends on visitor mix and local play, not headcount alone |
| Premium and VIP gaming | Low | Driven by a small number of high-value players and credit policy |
The condition most readers skip: heads are not spend
A 1.7% decline in arrivals is compatible with flat revenue, rising revenue or falling revenue, depending on which visitors went missing. Lose a slice of short-stay regional day-trippers and the revenue impact is small. Lose premium customers who book suites and play at high limits and the revenue impact is disproportionate, even if the arrivals line barely moves.
Because the reported data carries no market-level breakdown, that question is currently unanswerable from this release alone. Which is exactly why the number deserves less weight than its circulation suggests.
Is this a Singapore story or an Asian one?
There is no verifiable basis in this release for calling it a regional pattern, and the honest answer is that a single nine-month arrivals series from one destination cannot establish one. What can be said directionally is that Asia’s casino-tourism recovery has been uneven rather than uniform, with Macau’s rebound in visitation running ahead of its gaming revenue recovery relative to pre-pandemic levels, and with the regional supply picture still shifting as Japan’s first integrated resort in Osaka works towards an opening later this decade.
Blip or structural trend: what would have to be true
Several forces could produce a sub-2% arrivals decline without any change in underlying demand for Singapore as a destination. Currency moves make the city more or less expensive for regional travellers from one year to the next. Airline seat capacity on specific routes expands and contracts. A strong prior-year comparison base, built on event calendars and concert tours, can flatter one year and penalise the next. Competing destinations in Southeast Asia and North Asia discount aggressively when their own occupancy softens.
A structural reading would require something different: a sustained multi-period decline, visible across several source markets at once, accompanied by falling room rates and weakening forward MICE bookings. None of that is demonstrated by a 1.7% move over nine months.
Reading the Singapore casino tourism decline: where I come down
I read this as noise around a plateau rather than the start of a decline, and I would not reprice a view on Marina Bay Sands or Resorts World Sentosa on the strength of it. A 1.7% variance sits inside the range that currency, flight capacity and base effects can produce on their own, and it tells you nothing about visitor mix, stay length or spend.
The opposing reading is not foolish. If you believe Asia’s post-reopening travel surge has run its course and that regional capacity is now competing for a flat pool of travellers, then the first year arrivals stop growing is precisely the year you would expect to see a small negative print. That interpretation is internally consistent. It is simply not yet supported by this particular data set, and the difference between the two views will be settled by the next few releases rather than by argument.
What to watch next
The fourth-quarter and full-year Singapore Tourism Board arrivals data, ideally with market-level detail, will show whether the softness broadened or reversed. Pair it with the next round of operator results from Las Vegas Sands and Genting Singapore, where gaming and non-gaming segments are disclosed separately, plus any commentary on hotel rates and forward MICE bookings. Two consecutive weak prints with a consistent market mix would change the picture; one would not.